
The Rangers are a terrible defensive team. As of their midseason break (42 games), they are one of the worst teams in generating shots (Corsi For) and preventing shots (Corsi Against).
courtesy of the indispensable Sean Tierney (@ChartingHockey)
Now some people believe that the Rangers are purposefully focusing less on overall shots, and more on getting, and preventing, the good, high quality, shots. This may be true...I am not In the Room with the team and coaches. But even if this is the plan, the Rangers also are pretty bad at preventing high-quality chances against.

coutresy of the indispensable Micah Blake McCurdy (@IneffectiveMath)
Why the Rangers are bad in their end is hard to pinpoint without understanding (1) what their defensive strategy is, and (2) watching a lot of video to see how they are performing. For the former, I recommend you read BlueSeatBlogs' series on hockey systems (and the Rangers under Alain Vigneault in particular). For the latter, I recommend you study to become a Time Lord.
But in general, we know a few, obvious, things: To defend goals, you need to prevent shots against. To prevent shots against, you want to keep the puck out of your zone, and when it's in there, get it out. But how do you do that? One area of hockey statistical analysis that continues to grow as we obtain more data are zone entries and zone exits, and their effect on puck possession.
For example, Michael Zsolt, the Director of Analytics for the Kitchener Rangers (@OrgSixAnalytics), demonstrated that preventing Zone Entries may be a repeatable skill, and defenders who are good at exiting the zone with control help improve possession. Dmitri Filipovic has also looked at how defencemen can control play by strong play at their defensive blue line. All of this makes some logical sense - if you are a guy who just blindly tosses the puck off the boards to "get it out of trouble", you are basically just giving it back to the other team to regroup and try to bring it back in the zone. [Again the Rangers may believe they have figured out how to fix this issue, or at least live ith with the risks this issue brings.]
Below I'll look at how the Rangers current defensemen have performed so far in 2017 by looking at zone entries/exits tracking data. None of this work could be done without a lot of hard effort, notably from Corey Sznajder (@ShutdownLine) and his tracking data. Please consider donating a few bucks a month to Corey's patreon. Corey has prioritized getting Rangers games done over other teams, so we have a pretty good amount of data (25 games for full time players) to work with so far.
First, let's look at the NYR's Zone Entry Defense. Zone entry defense matters because we know that controlled entries into the offensive zone generate more shots than dump ins. If a defensemen can limit controlled entries against, he should be helping his team reduce shots against.

data courtesy of the indispensable @ShutdownLine
Here we see how the 7 primary NYR defensemen have faired at breaking up carry-in attempts. These are raw numbers, but only two defensemen - McDonagh and Smith - break up more than 10% of the opposition blue line carry ins. That could be related to their willingness to attack the puck carrier as opposed to someone like Marc Staal who may be more willing to retreat and let the carrier gain the zone. That said, these numbers at least suggest that the NYR are conceding the blue line too easily.
Zone entries are only part of the story of course. Pucks are going to be in the zone sooner or later, and how you get them out matters too. To look at zone exits, I'm going to steal an idea from @LedgerSko, a writer at OnTheForecheck, who looked at Nashville's defensemen earlier this season. LedgerSko compared a player's carry-in % (how often the player allowed a clean entry with possession) to his possession-exit % (how often the player moved the puck out of the zone with posession by either skating it out or a completed pass) and the divided the results into 4 quadrants:
- Open Blue Line (FUN)- Above-average controlled entries against and controlled exits for
- Closed Blue Line (BORING) - Below-average controlled entries against and controlled exits for
- Neutral Zone Liability (BAD) - Above-average controlled entries against and below-average controlled exits for
- Neutral Zone Play Driver (GOOD) - Below-average controlled entries against, and above-average controlled exits for
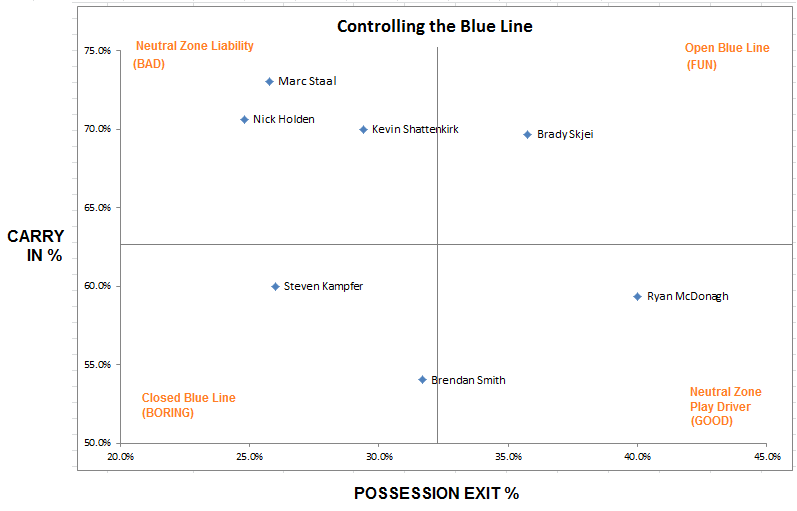
data courtesy of the indispensable @ShutdownLine
The Rangers only have 1 "good" defensemen (McDonagh) and 3 "bad" defensemen (Staal, Holden, and Shattenkirk). I used the quotes, though, because notice the x-axis scale. The Rangers have no full-time defenseman who has a possession exit percentage better than 50%. [Tony DeAngelo was at 53.8% for 8 games tracked]. I also find it interesting that McDonagh, Smith and Kampfer appear to be the more "aggressive" blue line defenders in that they are around 55-60% carry in percentage. I don't know what to make of Skjei - he doesn't appear to break up many carry ins, and his possession exit% seems mediocore at 35.8%.
You would think that a defender with a high CarryIn% against probably forces less dump-ins, and you'd be right.

data courtesy of @ShutdownLine, image courtesy of @CJTDevil
The guys with the worst carry in % against have the lowest number of dump ins per attempt. This image comes from CJTurturo (@CJTDevil), one of the only Devils fans .......................................................................................................... ..........................................................................................................................worth following on Twitter. Sorry. I'm used to stopping after "fans" there.
Anyway, CJ took Corey's data and transformed into a cool Tableau tool, which shows us dump ins and more. It also allows us to see how the Rangers defensemen measure up against the rest of the league, and not just against the other Rangers defensemen. Remember that not every player has the same amount of tracked games - so the comparisons are not perfect - but I still think they are helpful.
NOTE: CJ updated this tool overnight with a more detailed look at the defensemen, so I replaced the original charts with those updated charts below.

data courtesy of @ShutdownLine, image courtesy of @CJTDevil
These images show offensive zone entries as well, so we want to focus on the bottom four lines only - which shows possession exits and entry defense. Don't get confused by the numbers on the bars - focus on the color. Red is always bad. Blue is always good.
Looking at the NYR "top" pairing, we see McDonagh actually isn't too bad compared to his peers - around the 70th percentile for possession exits, and 75-85th percentile in entry defense. So maybe McDonagh does deserve the "good" label I gave him above. Holden, on the other hand, clearly fits the "bad" label. It's really crazy that the NYR see something valuable in him.

data courtesy of @ShutdownLine, image courtesy of @CJTDevil
This give us more detail on Skjei - solid exits pretty much drops him into the "good 2nd pair" guy I think he is. But his entry defense seems to need some real work. Shattenkirk has a decent exit rate, but not a good percentage - meaning he's getting the puck out of the zone with possession a lot, but failing a lot of times too. His entry defense is also not good enough for a top 4 guy.

data courtesy of @ShutdownLine, image courtesy of @CJTDevil
Smith has the same issue as Shattenkirk when it come to exits - moves the puck a lot, with both good and bad results. His entry defense is outstanding. Maybe he needs a partner that has better skill once the puck is in the zone (McDonagh?). Staal, though, is baad. [See whaat I did there? It's aan aadvaanced technique.] Anyway, add these terrible numbers to Staal's high CarryIn% against - and he's not keeping the puck out of the zone, or getting it out once it's in there. It's all nice to have articles about Staal's "rebound" season, but this data suggests he didn't bounce back that far.

data courtesy of @ShutdownLine, image courtesy of @CJTDevil
I hesitated putting DeAngelo and Kampfer in here because of the low number of games tracked, but decided it's better to be complete. I don't place much stock in these numbers results at all for long-term planning or lineup construction.
So what difference does this make?
How a defenseman succeeds/fails in his zone entry defense and exits doesn't tell the whole story. A defender breaking up a play entering the zone doesn't necessarily mean that that player or his team has gained possession of puck. Further, how a defensemen plays an attack on the blue line can be impacted by his partner, the team's forwards, how well the goalie moves the puck [*coughHANKSTAYINNETcough*], and how the play developed in the neutral zone in the first place. But we know from both data and common sense that zone entries and exits matter. This more granular data at least suggests that the NYR struggle in their end both because the defensemen allow entry into the zone too easily, and because they aren't able to move the puck out cleanly once it's there.
...Again I'm right in my analysis.